Research
Blind source separation
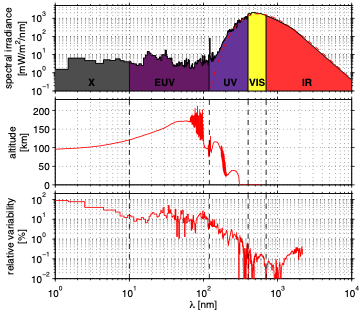
Figure 2: from top to bottom: average solar spectral irradiance, the altitude at which wavelengths are predominantly absorbed, and the variability over one solar cycle. Data are from TIMED and SORCE.
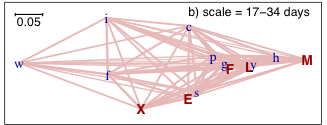
Figure 3 : Comparison between various solar proxies (small letters ) and different spectral bands in the UV range (capital letters X, E, F, L and M). The shorter the distance between two letters, the easier it is to reconstruct one from the other. This comparison only applies to variations occurring on time scales of 17-34 days.
Blind source separation and hyperspectral unmixing have recently become very active fields of research. The objective is to recover individual source signals from their mixture with the least possible information about these sources or their mixing.
We were the first to apply this concept to solar UV spectra, with the aim to identify elementary spectra. Surprisingly, most of the solar spectral variability in the UV can be reproduced by the linear combination of three elementary sources that correspond to emissions coming from specific layers of the solar atmosphere (read more). See Figure 4.
We are now using this approach to decompose multispectral solar images into their sources and extract from these information about the temperature of the solar corona. Our objective is to deliver in real-time three-temperature maps of the Sun for space weather applications, see for example Figure 5.
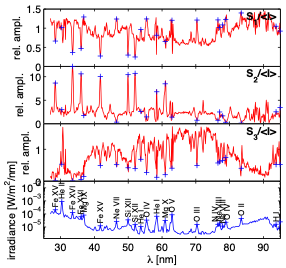
Figure 4 : Excerpt of the three elementary spectra (in red) and average solar spectrum in the UV (blue). The elementary spectra are normalised to the average spectrum.
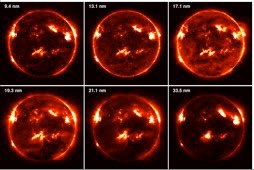
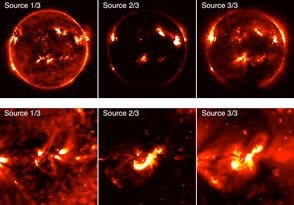
Original images from SDO/AIA in 6 wavelengths, in the EUV
(9.4, 13.1, 17.1, 19.3, 21.1, 33.5 nm)
Their 3 source images (upper row) and an excerpt (bottom row)
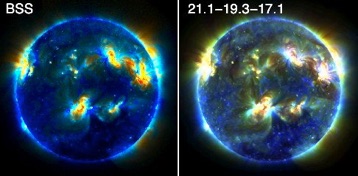
Temperature map obtained by assigning the blue channel to the cold source, the green one to the intermediate source and the red channel to the hottest one. This single picture condenses all the salient features contained in the original images.
Left picture : temperature map from sources. Right picture : classical composite map from spectal bands.
Figure 5 : Example of the 3-temperature map construction from solar images taken in the EUV.
T. Dudok de Wit
1/2/2019
Solar spectral variability

Ultraviolet emissions represent only about 9% of the total power that is radiated by the Sun and yet they receive much more attention because of their high variability, see Figure 2. These emissions may also provide one of the links by which the Sun affects climate (read more.).
Most UV emissions cannot be measured from ground because of their absorption in the upper atmosphere. In addition to that, space borne instruments suffer from degradation. For these reasons, there have been many attempts to reconstruct the solar UV spectrum from ground-based solar proxies such as the sunspot number.
We have developed a statistical technique that allows for the first time the relevance of all these solar proxies to be evaluated in a single glance, see Figure 3. (read more)
Real-time reconstruction of the solar spectrum
In many applications there is a need for combining multiple incomplete observations into one single and homogeneous composite record.
We have developed a new statistical framework for doing so, which combines Bayesian statistics and multiscale (i.e. wavelet) decompositions. Recently we delivered a new Total Solar Irradiance composite dataset, which will become the reference for the IPCC. The Total Solar Irradiance expresses the total amount of solar radiative energy received by the Earth and is a vital quantity for climate studies.
For more information, see article
Data fusion
Figure 1 : The original Total Solar Irradiance observations that need to be combined into one single composite record
Parker Solar Probe mission
Parker Solar Probe is the first mission to dive into the solar corona, getting as close as 6 million km from the surface of our star. The mission aims at solving one of the biggest mysteries of modern physics: why is the solar corona so much hotter than its surface ? Our team from LPC2E contributes to the mission by providing a search-coil magnetometer (SCM) that measures magnetic field fluctuations.
Parker Solar Probe was successfully launched on August 12, 2018.
See here where the satellite is today.
Official website :
Some of the topics I am currently working on