
|
|
|
Reconstruction and Short-term Forecast of the Total Solar Irradiance
|
|
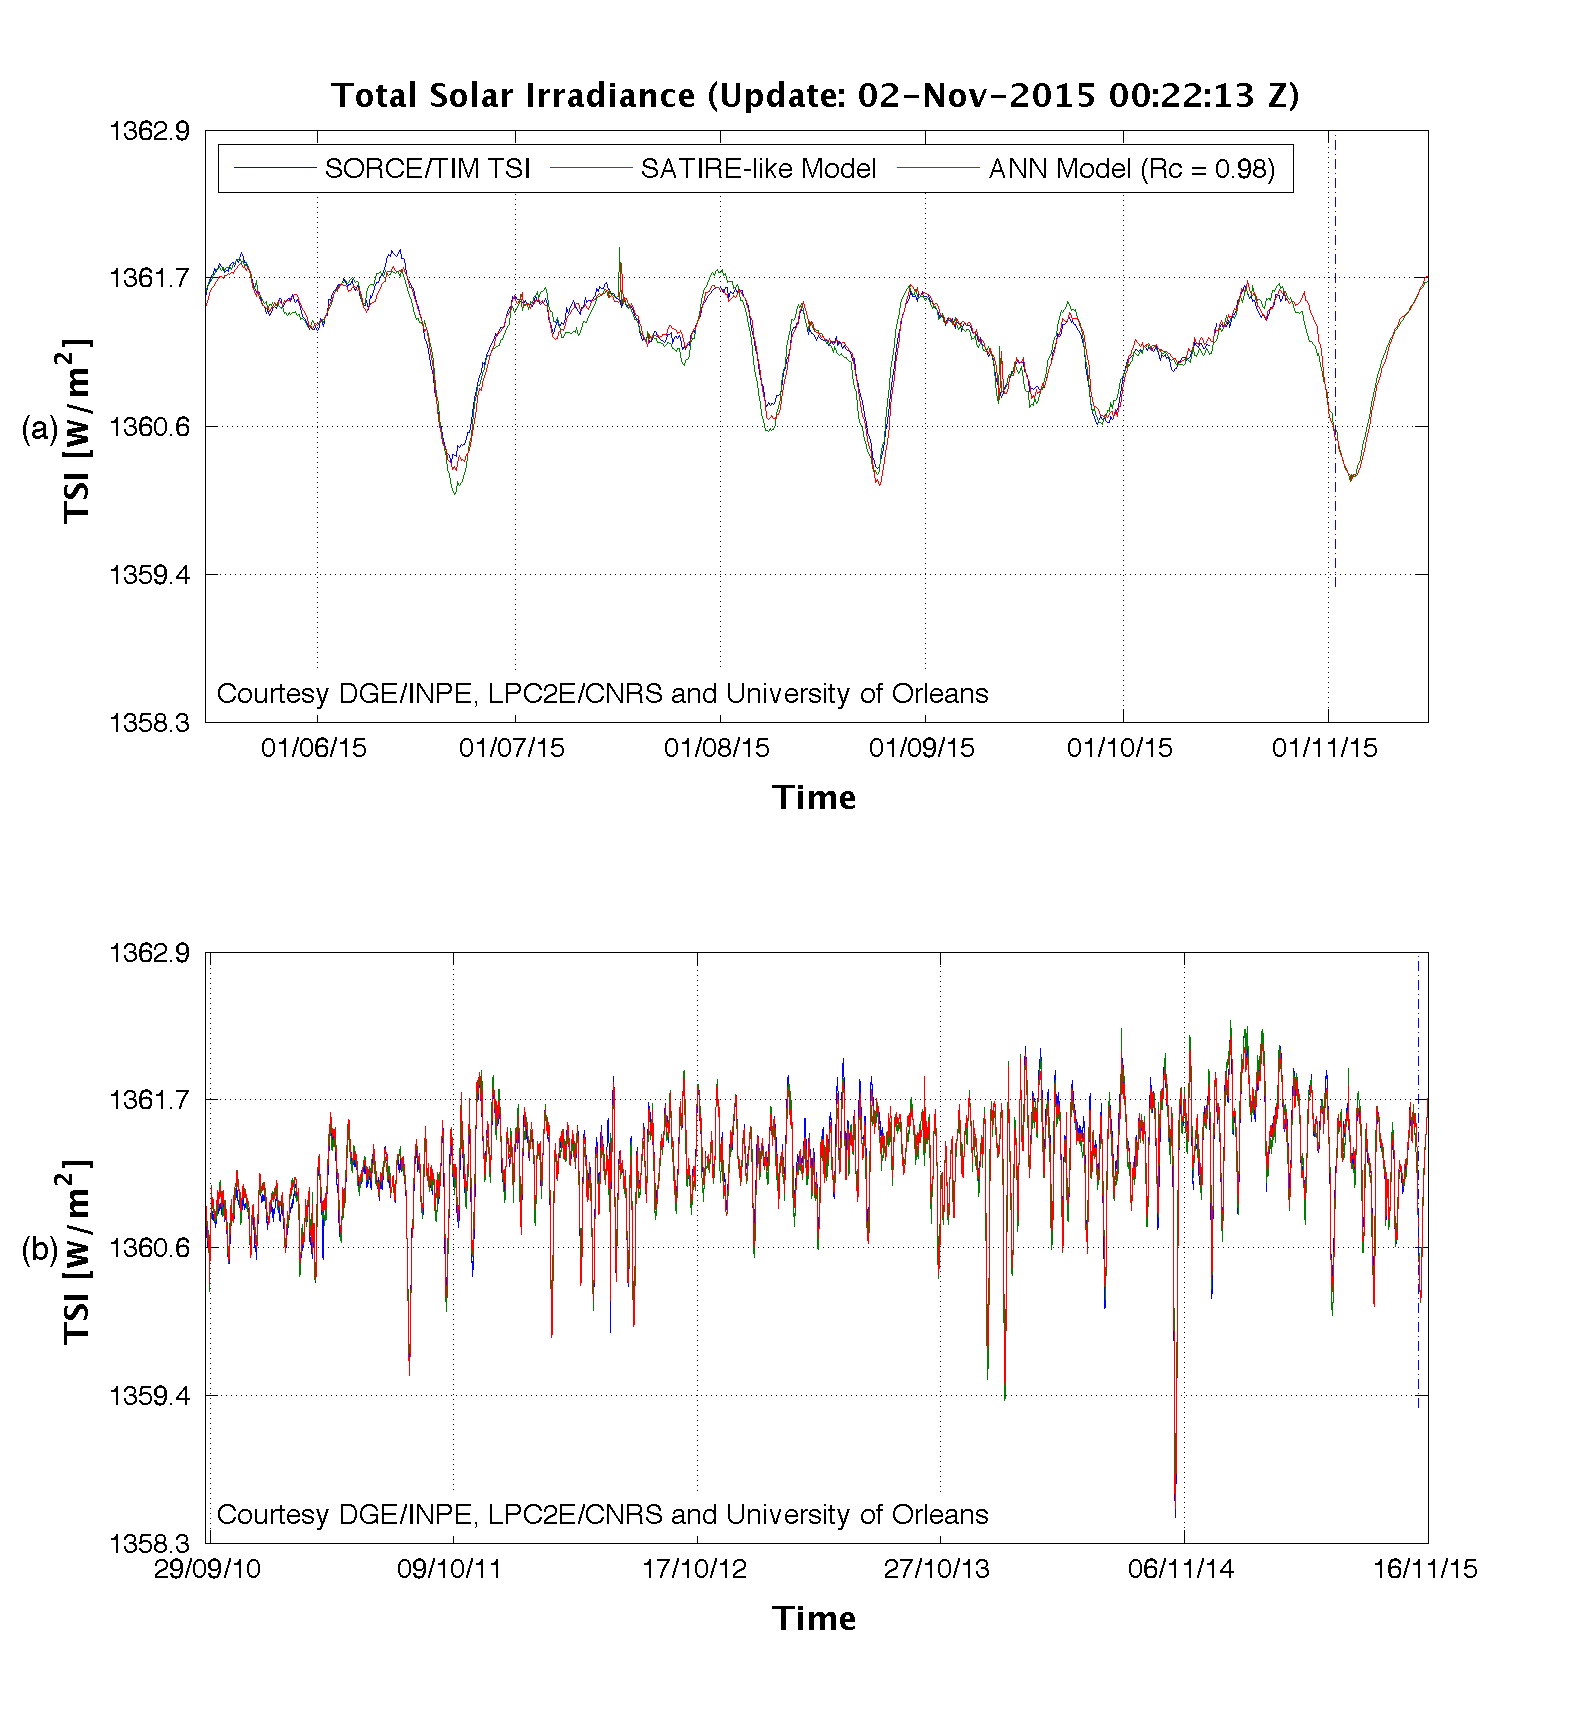
Comparison between the TSI measured by TIM instrument on board of SORCE spacecraft (blue)
and computed employing the neural network model (red line). For reference, the green line
displays the TSI computed employing a SATIRE-like model. The dashed vertical blue line presents
the time instant of the last update. Data file: tsi_last.txt
|
|
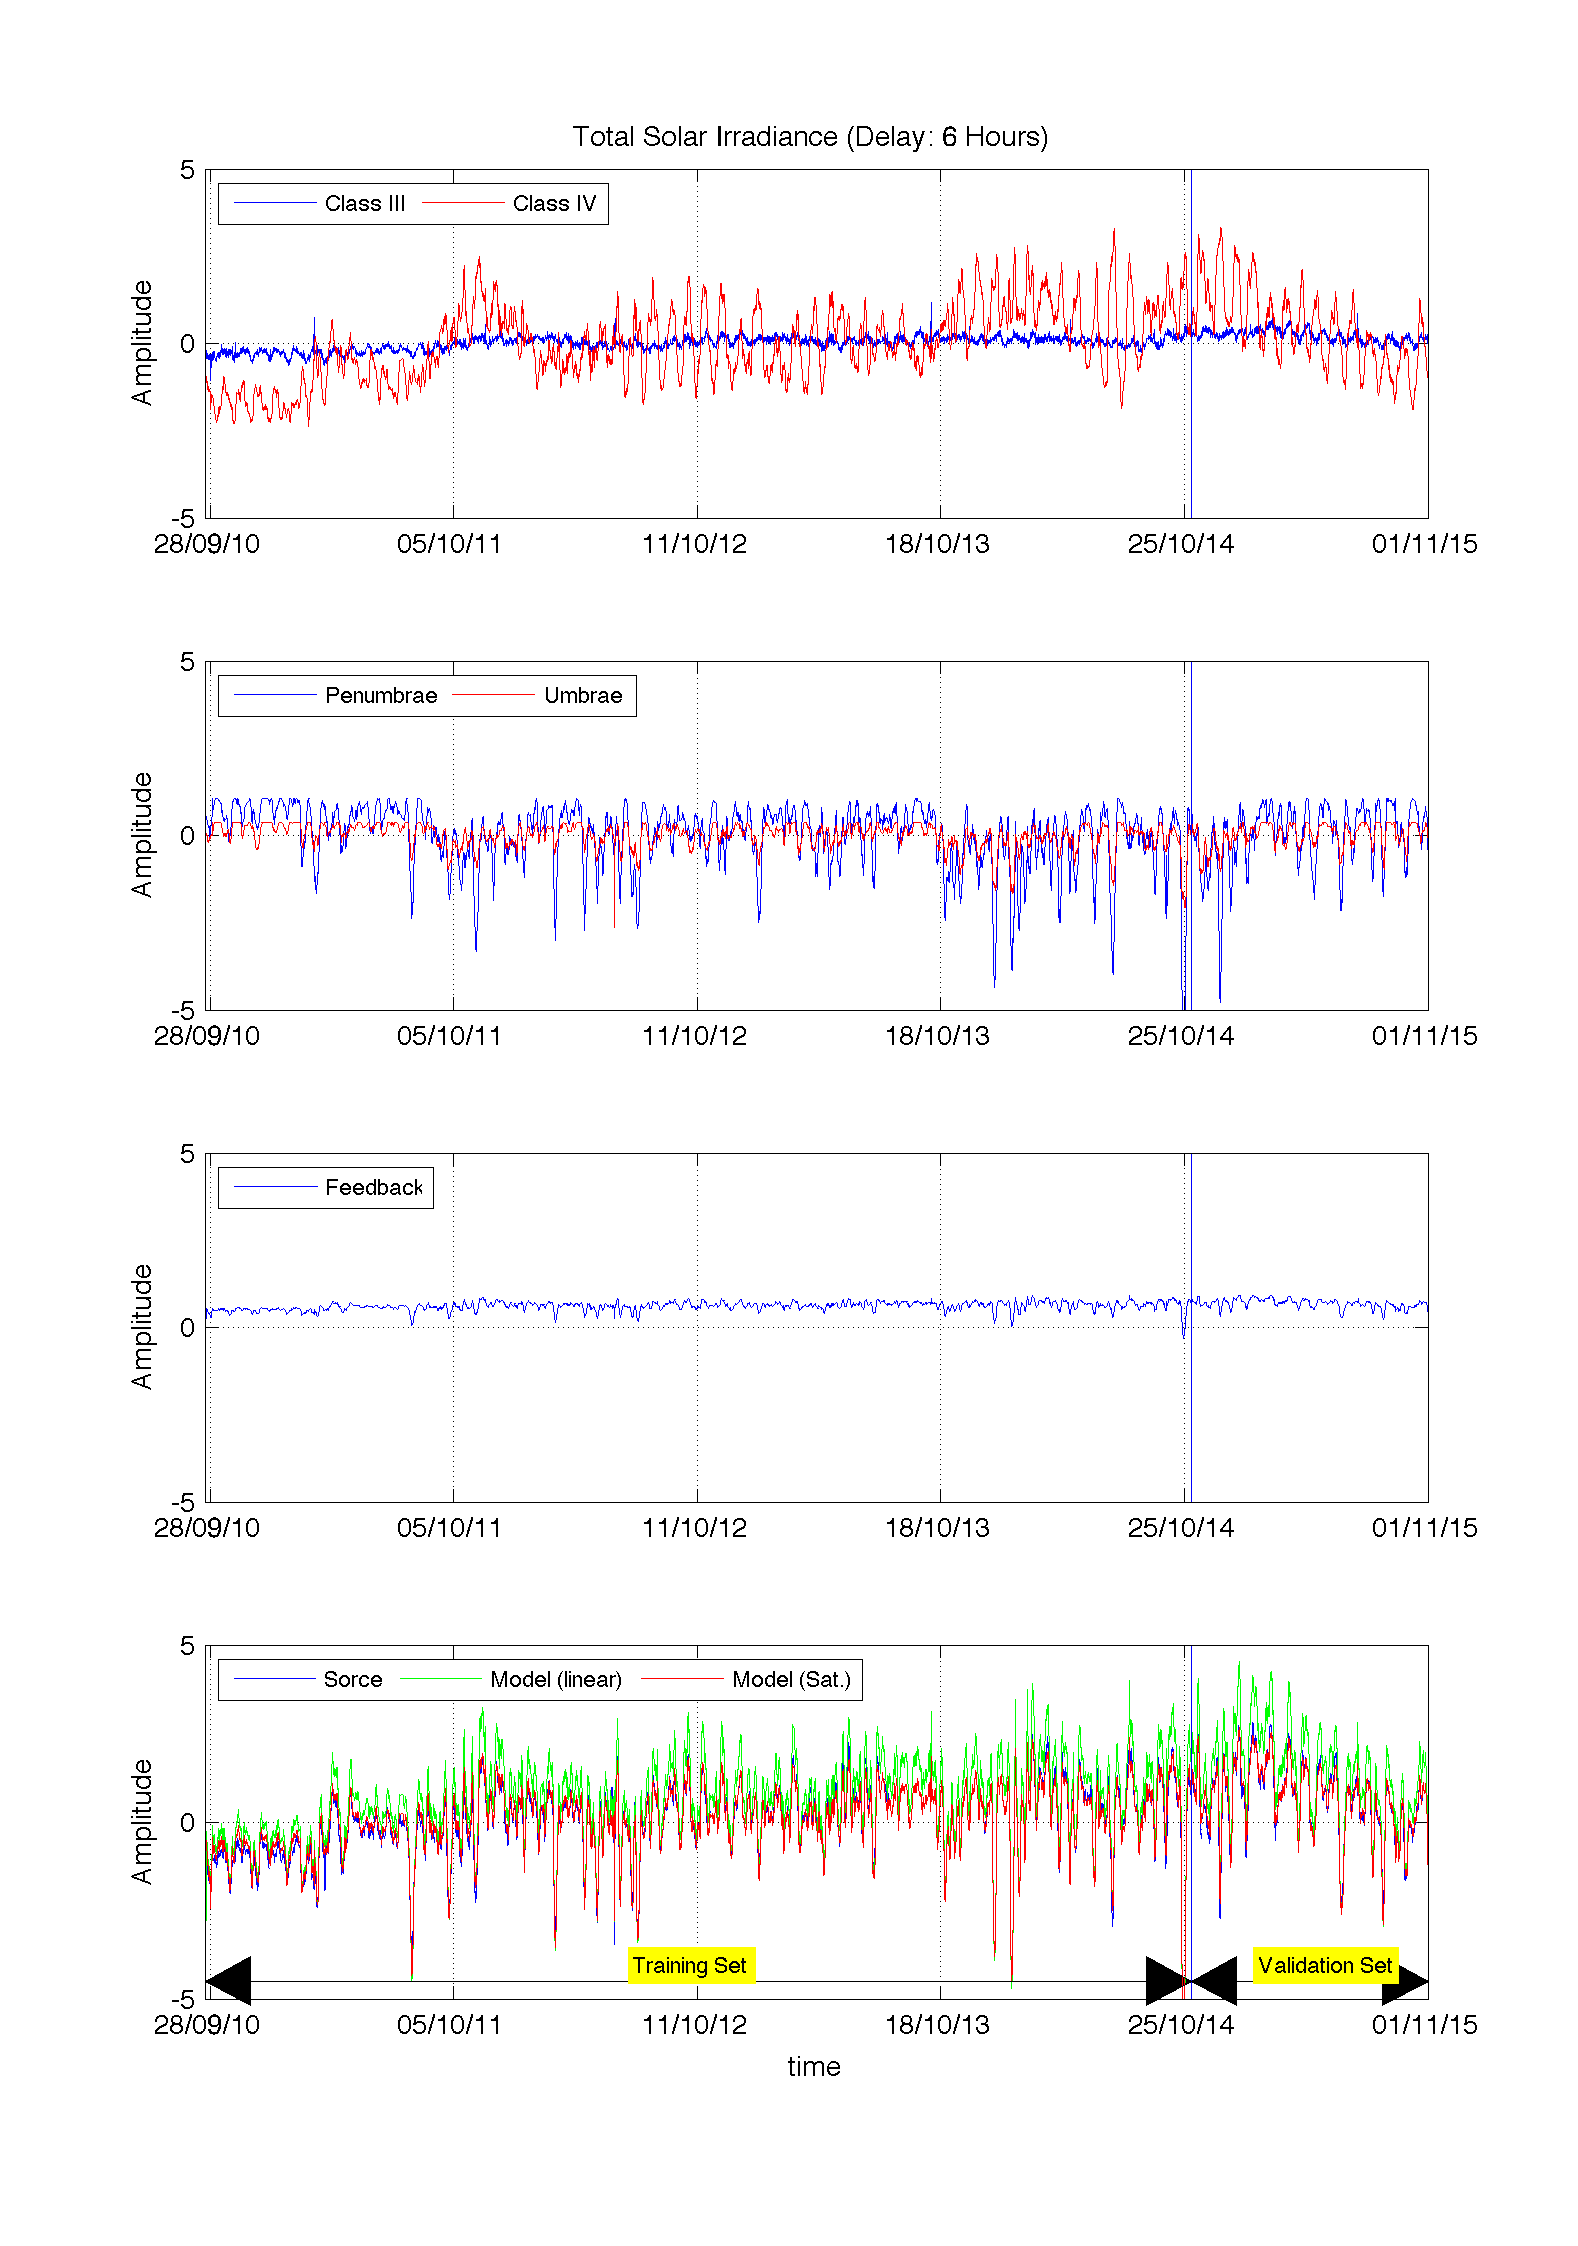
Example of a 06-hour forecast training section of the neural network model for the TSI.
The upper panel shows the evolution of the contributions from classes II, III, and IV. The Panel (b)
presents the evolution of umbrae and penumbrae. The panel (c) shows the evolution of the feedback of the
first layer to the input of this layer. The panel (d) shows a comparison between the output of the model
(red curve) and the observations. For reference, the output of the same model, but with a linear transfer
function in the hidden layer is presented. The training and validation sets are marked in the panel (d).
|